
Show google analytics statistics in django admin
You can also be interested in:


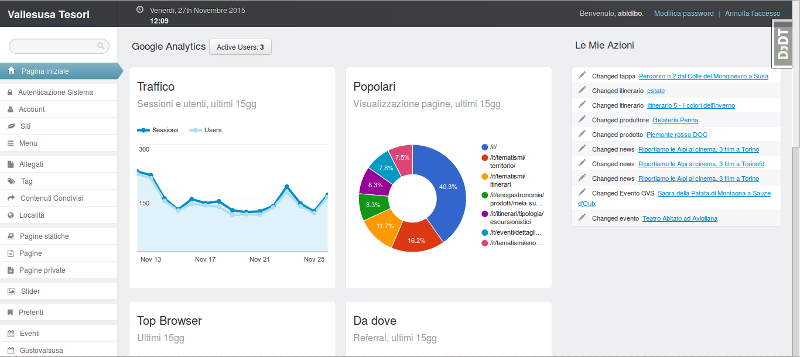
In this post we'll see how to show google analytics statistics inside your admin index. If you use django-suit as your admin application then you could simply install django-otto-admin and follow the provided instructions to get it working.
Requirements
First of all we need to create a google developer project and a service account which will allow us to authenticate to the google analytics account.
Follow the steps in the Google Identity Platform documentation to create a service account from the Google Developer Console.
Once the service account is created, you can click the Generate New JSON Key button to create and download the key and add it to your project. Place the json file in a secure place, not reachable through web navigation, but accessible from within your project python code.
Then just go in the admin settings of the google analytics account you want to use, and add the email created in the previous step to the Google Analytics views you'd like to request data from. It's generally best to only grant the service account read-only access. Take note of the view ID.
Software requirements
- google-api-python-client
So just
$ pip install google-api-python-client
Implementation
We need to do 3 things:
- create a templatetag to show the widgets
- create the template which displays the widgets
- overwrite the django admin index template and use the new tag
Create the templatetag
Just create a new templatetags module or add the following tag to an existing one
import json
from oauth2client.client import SignedJwtAssertionCredentials

from django import template

register = template.Library()

@register.inclusion_tag('myapp/analytics.html', takes_context=True)
def analytics(context, next = None):

    ANALYTICS_CREDENTIALS_JSON = 'absolute/path/to/service.json'
    ANALYTICS_VIEW_ID = 'Google Analytics View ID here'

    # The scope for the OAuth2 request.
    SCOPE = 'https://www.googleapis.com/auth/analytics.readonly'

    # The location of the key file with the key data.
    KEY_FILEPATH = ANALYTICS_CREDENTIALS_JSON

    # Load the key file's private data.
    with open(KEY_FILEPATH) as key_file:
        _key_data = json.load(key_file)

    # Construct a credentials objects from the key data and OAuth2 scope.
    _credentials = SignedJwtAssertionCredentials(
        _key_data['client_email'], _key_data['private_key'], SCOPE)

    return {
        'token': _credentials.get_access_token().access_token,
        'view_id': ANALYTICS_VIEW_ID
    }
Here for example you can define the two "constants" in your settings file and import them.
Create the templatetag template
{% load i18n %}
<script>
(function(w,d,s,g,js,fs){
  g=w.gapi||(w.gapi={});g.analytics={q:[],ready:function(f){this.q.push(f);}};
  js=d.createElement(s);fs=d.getElementsByTagName(s)[0];
  js.src='https://apis.google.com/js/platform.js';
  fs.parentNode.insertBefore(js,fs);js.onload=function(){g.load('analytics');};
}(window,document,'script'));
</script>
<!-- Include the ActiveUsers component script. -->
<script src="https://ga-dev-tools.appspot.com/public/javascript/embed-api/components/active-users.js"></script>
<script src="https://ga-dev-tools.appspot.com/public/javascript/embed-api/components/view-selector2.js"></script>


<h4 class="italic-title">Google Analytics <span class="btn btn-default" id="active-users-container"></span></h4>
<!-- this is just to make the view selector work, no need to display it -->
<div id="view-selector-container" style="display: none"></div>

<div class="row-fluid" style="margin: 20px 0;">
    <div class="span6">
        <section class="panel">
            <h1>{% trans 'Traffic' %}</h1>
            <h2>{% trans 'Sessions and Users, last 15 days' %}</h2>
            <div id="chart-1-container"></div>
        </section>
    </div>
    <div class="span6">
        <section class="panel">
            <h1>{% trans 'Popular' %}</h1>
            <h2>{% trans 'Page views, last 15 days' %}</h2>
            <div id="chart-2-container"></div>
        </section>
    </div>
</div>
<div class="row-fluid" style="margin: 20px 0;">
    <div class="span6">
        <section class="panel">
            <h1>{% trans 'Top Browsers' %}</h1>
            <h2>{% trans 'Last 15 days' %}</h2>
            <div id="chart-3-container"></div>
        </section>
    </div>
    <div class="span6">
        <section class="panel">
            <h1>{% trans 'Acquisition' %}</h1>
            <h2>{% trans 'Referral Traffic, last 15 days' %}</h2>
            <div id="chart-4-container"></div>
        </section>
    </div>
</div>
<div class="row-fluid" style="margin: 20px 0;">
    <div class="span6">
        <section class="panel">
            <h1>{% trans 'Audience' %}</h1>
            <h2>{% trans 'Countries, last 15 days' %}</h2>
            <div id="chart-5-container"></div>
        </section>
    </div>
    <div class="span6">
        <section class="panel">
            <h1>{% trans 'Social' %}</h1>
            <h2>{% trans 'Interactions, last 15 days' %}</h2>
            <div id="chart-6-container"></div>
        </section>
    </div>
</div>


<script>

gapi.analytics.ready(function() {

    /**
     * Authorize the user with an access token obtained server side.
     */
    gapi.analytics.auth.authorize({
        'serverAuth': {
            'access_token': '{{ token }}'
        }
    });

    /**
     * Create a new ActiveUsers instance to be rendered inside of an
     * element with the id "active-users-container" and poll for changes every
     * five seconds.
     */
    var activeUsers = new gapi.analytics.ext.ActiveUsers({
        container: 'active-users-container',
        pollingInterval: 5
    });

    /**
     * Create a new ViewSelector2 instance to be rendered inside of an
     * element with the id "view-selector-container".
     */
    var viewSelector = new gapi.analytics.ext.ViewSelector2({
        container: 'view-selector-container',
    })
    .execute();

    /**
     * Update the activeUsers component, the Chartjs charts, and the dashboard
     * title whenever the user changes the view.
     */
    viewSelector.on('viewChange', function(data) {
        // Start tracking active users for this view.
        activeUsers.set(data).execute();
    });

    /**
     * Creates a new DataChart instance showing sessions over the past 15 days.
     */
    var dataChart1 = new gapi.analytics.googleCharts.DataChart({
        query: {
            'ids': 'ga:{{ view_id }}',
            'start-date': '15daysAgo',
            'end-date': 'yesterday',
            'metrics': 'ga:sessions,ga:users',
            'dimensions': 'ga:date'
        },
        chart: {
            'container': 'chart-1-container',
            'type': 'LINE',
            'options': {
                'width': '100%'
            }
        }
    });
    dataChart1.execute();


    /**
     * Creates a new DataChart instance showing top 5 most popular pages
     */
    var dataChart2 = new gapi.analytics.googleCharts.DataChart({
        query: {
            'ids': 'ga:{{ view_id }}',
            'start-date': '15daysAgo',
            'end-date': 'yesterday',
            'metrics': 'ga:pageviews',
            'dimensions': 'ga:pagePath',
            'sort': '-ga:pageviews',
            'max-results': 7
        },
        chart: {
            'container': 'chart-2-container',
            'type': 'PIE',
            'options': {
                'width': '100%',
                'pieHole': 4/9,
            }
        }
    });
    dataChart2.execute();

    /**
     * Creates a new DataChart instance showing top borwsers
     */
    var dataChart3 = new gapi.analytics.googleCharts.DataChart({
        query: {
            'ids': 'ga:{{ view_id }}',
            'start-date': '15daysAgo',
            'end-date': 'yesterday',
            'metrics': 'ga:sessions',
            'dimensions': 'ga:browser',
            'sort': '-ga:sessions',
            'max-results': 7
        },
        chart: {
            'container': 'chart-3-container',
            'type': 'PIE',
            'options': {
                'width': '100%',
                'pieHole': 4/9,
            }
        }
    });
    dataChart3.execute();

    /**
     * Creates a new DataChart instance showing top referral
     */
    var dataChart4 = new gapi.analytics.googleCharts.DataChart({
        query: {
            'ids': 'ga:{{ view_id }}',
            'start-date': '15daysAgo',
            'end-date': 'yesterday',
            'metrics': 'ga:sessions',
            'dimensions': 'ga:source',
            'sort': '-ga:sessions',
            'max-results': 7
        },
        chart: {
            'container': 'chart-4-container',
            'type': 'PIE',
            'options': {
                'width': '100%',
                'pieHole': 4/9,
            }
        }
    });
    dataChart4.execute();

    /**
     * Creates a new DataChart instance showing top visitors continents
     */
    var dataChart5 = new gapi.analytics.googleCharts.DataChart({
        query: {
            'ids': 'ga:{{ view_id }}',
            'start-date': '15daysAgo',
            'end-date': 'yesterday',
            'metrics': 'ga:sessions',
            'dimensions': 'ga:country',
            'sort': '-ga:sessions',
            'max-results': 7
        },
        chart: {
            'container': 'chart-5-container',
            'type': 'PIE',
            'options': {
                'width': '100%',
                'pieHole': 4/9,
            }
        }
    });
    dataChart5.execute();

    /**
     * Creates a new DataChart instance showing social interactions over the past 15 days.
     */
    var dataChart6 = new gapi.analytics.googleCharts.DataChart({
        query: {
            'ids': 'ga:{{ view_id }}',
            'start-date': '15daysAgo',
            'end-date': 'yesterday',
            'metrics': 'ga:socialInteractions',
            'dimensions': 'ga:socialInteractionNetwork',
            'sort': '-ga:socialInteractions',
            'max-results': 7
        },
        chart: {
            'container': 'chart-6-container',
            'type': 'PIE',
            'options': {
                'width': '100%',
                'pieHole': 4/9,
            }
        }
    });
    dataChart6.execute();

});
</script>
The grid part here is written for bootstrap 2.3.2, the one used by django-suit, change it to fit your needs.
This code displays 7 widgets:
- Realtime active users
- Traffic (sessions and users), last 15 days
- Popular Page views, last 15 days
- Top Browsers, last 15 days
- Referral traffic, last 15 days
- Visitors Countries, last 15 days
- Social actions, last 15 days
Would you like something different?
Just dig into the google analytics embed API documentation and change the js code to create your own widgets.
Create the django admin index template
We just need to use the created templatetag. So you can decide which method you prefer, for example you can overwrite the admin index template, just load the templatetag library and insert the tag for example in the content block.
{% load myapp_tags %}

...

{% block content %}
    <div id="content-main">
        {% analytics %}
    </div>
{% endblock %}

...
You will probably want to customize a bit the layout, just add some css in the extrastyle block.
I used exactly these concepts to write the django-otto-admin app, which is designed for django-suit admin, that you can simply install typing
$ pip install django-otto-admin
Your Smartwatch Loves Tasker!

Your Smartwatch Loves Tasker!
Featured
Django admin and bootstrap 5
Bootstrap 5 has come, currently in beta release, and seems already very stable.
So the question is: are you looking for ...

About code optimization, learn from exercises
Let's see an example of exercise you can face during a job interview, and let's use it to understand some ...

Notes on the Pearson correlation coefficient
The Pearson correlation coefficient is a measure of the linear correlation between two variables X and Y. It has a ...
Archive
- 2021
- 2020
- 2019
- 2018
- 2017
- Nov
- Oct
- Aug
- Jun
- Mar
- Feb
- 2016
- Oct
- Jun
- May
- Apr
- Mar
- Feb
- Jan
- 2015
- Nov
- Oct
- Aug
- Apr
- Mar
- Feb
- Jan
- 2014
- Sep
- Jul
- May
- Apr
- Mar
- Feb
- Jan
- 2013
- Nov
- Oct
- Sep
- Aug
- Jul
- Jun
- May
- Apr
- Mar
- Feb
- Jan
- 2012
- Dec
- Nov
- Oct
- Aug
- Jul
- Jun
- May
- Apr
- Jan
- 2011
- Dec
- Nov
- Oct
- Sep
- Aug
- Jul
- Jun
- May